


Autism in the United States: When 1 in 36 is Really 1 in 8
Autism in the United States, according to the CDC's own data and rate of increase

On August 23, 2024, Robert F. Kennedy, Jr. addressed the nation, announcing that he was suspending his campaign for president of the United States. I watched the speech live. If you haven’t seen it, I highly recommend watching.
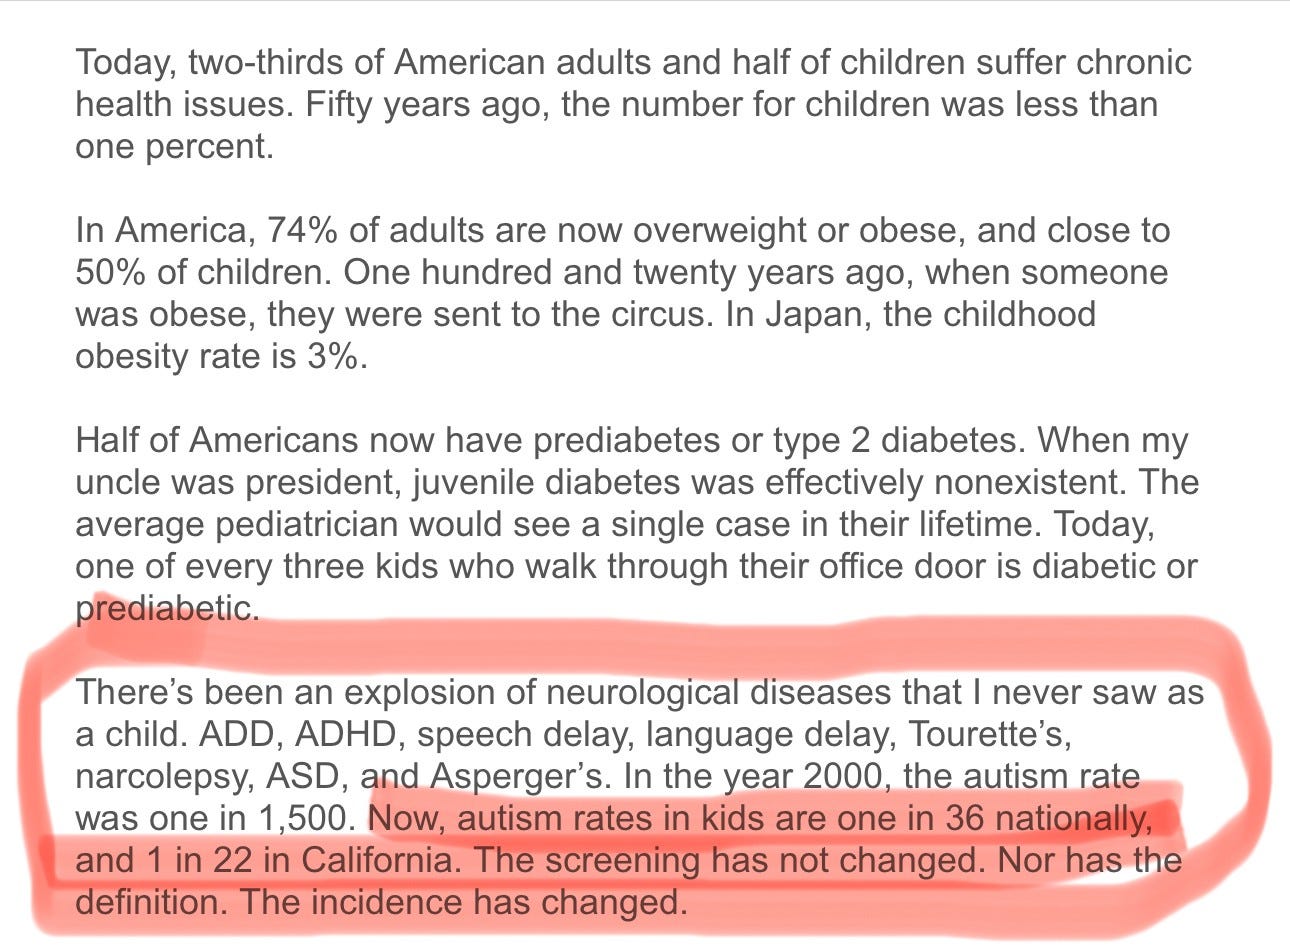
In my opinion, the most important thing Mr. Kennedy said in that speech was this:
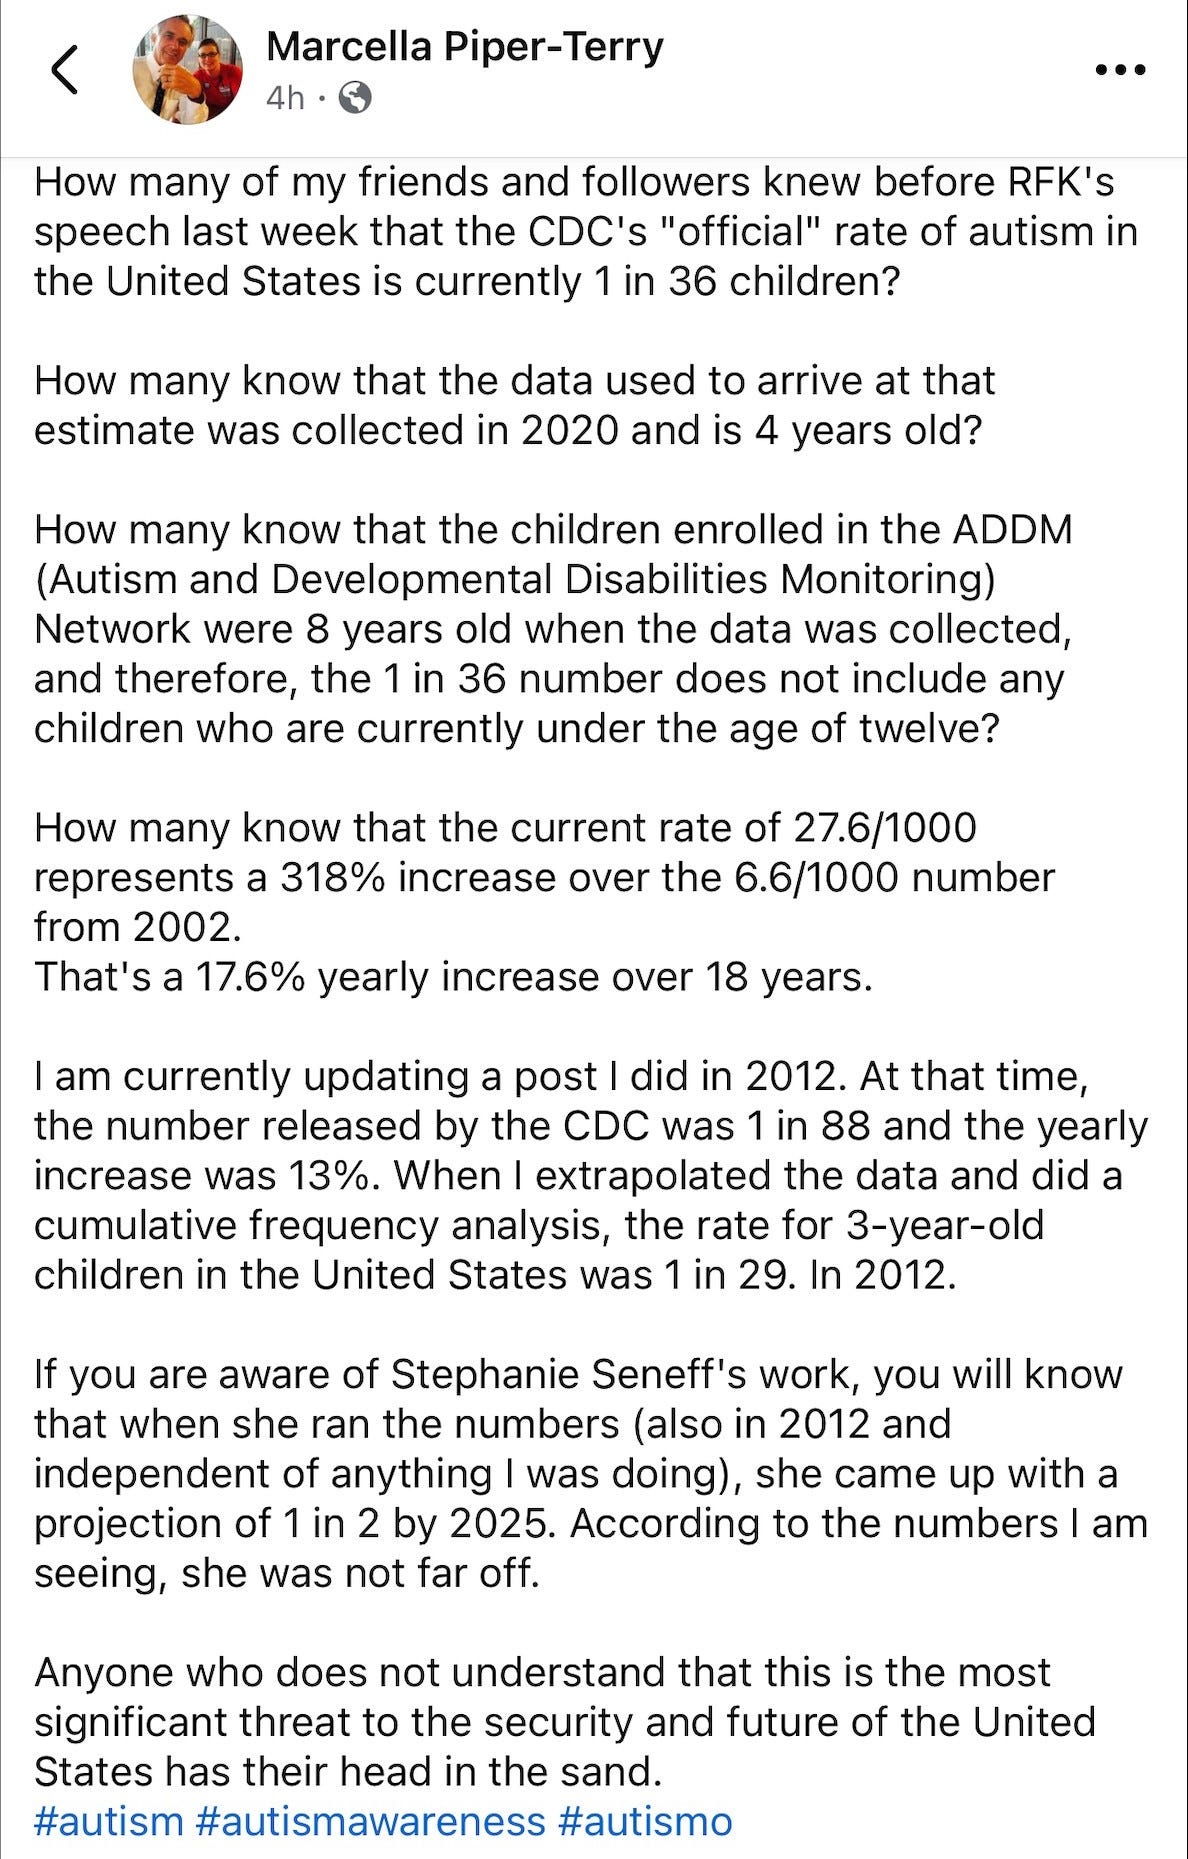
A few days later, I made this Facebook post:
Here is a link to the article I wrote in 2012, which was published on VaxTruth. I am updating that article here, doing the same kind of cumulative frequency calculation I did then, and expanding a bit on what we know about the causes of the increase in chronic illness affecting our children. The first part of this article contains the text of the 2012 article, with additional information from the most recent CDC collection of ADDM data, and expanded discussion of environmental toxicity and the synergistic effects on our children. That information will be followed with the new cumulative frequency analysis.
From the 2012 article: When 1 in 88 is really 1 in 29…
In 2007 The CDC announced that autism affected 1 in 150 children in the United States. What the CDC failed to make clear to the general public is that the numbers they reported in 2007 were actually from data collected in 2002. The numbers were five years old. After the 2007 announcement from the CDC, Raymond W. Gallup and F. Edward Yazbak, M.D. FAAP wrote an article titled, “When 1 in 150 is Really 1 in 67.” As the authors of that article explained, the data reported in 2007 involved 8-year-old children who were born in 1994.
In 2012, The CDC released their “new” numbers, announcing that autism affected 1 in 88 children (1 in 54 boys) in the United States. True to form, The CDC failed to make it clear that the numbers they reported on March 29, 2012 were from data collected in 2008. The numbers were four years old. The CDC also failed to mention that their number of 1 in 88 reflected their calculation of autism for 8-year-old children who were enrolled in the Autism and Developmental Disabilities Monitoring (ADDM) Network. The ADDM Network monitors the rate of autism among children in select communities in the United States. At the time of the 2012 announcement, the ADDM consisted of fourteen sites. The following map of the United States shows the states (in blue) where ADDM data was collected during 2008 (released in 2012). However, please realize that even though the STATES are colored in blue, the data is only collected from very specific areas within each state. I think this is a little misleading, but then, we’re talking about The CDC so what can you expect?

When I look at the map above, the first thing I notice is that the information used to estimate the autism rate was gathered from states that, according to IDEA data, do not have the highest rates of autism. Again… It just seems that if the CDC really wanted to know the true extent of the autism epidemic (or really wanted to report it accurately), they would look at the areas where the rate is known to be the highest. Wouldn’t you think?
The table below shows the autism rate by state, according to the U.S. IDEA data. This is data that is reported by public school systems throughout the U.S. and reflects children who have an autism diagnosis and are receiving intervention services through the school system.

Looking at the table above and comparing that with the map of ADDM sites, we can see that of the ten states that have the highest rates of autism, according to the IDEA’s data, only one (Pennsylvania) was even looked at by the CDC. Well, maybe we should cut The CDC a break. After all, the table above shows the autism rate for the 2009-2010 school year and the ADDM data was gathered in 2008.
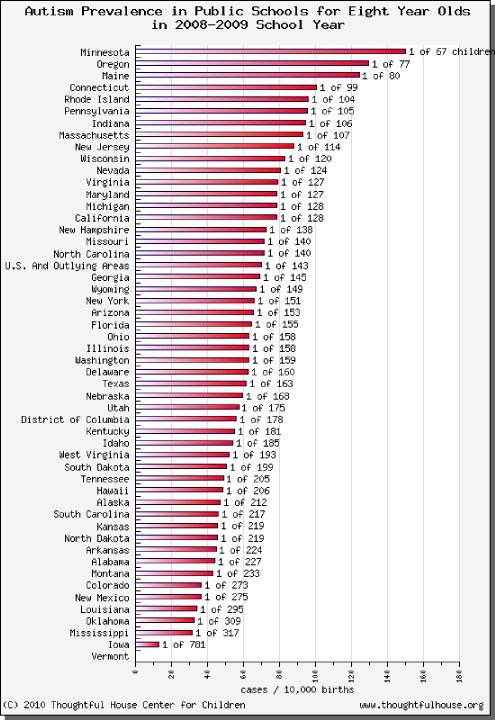
This graph is from 2008-2009 school year… admittedly still too close to the 2008 data collection for The CDC to plan. Somewhere I have the graphs from earlier years, but for now I’m just going to have to go on record as saying that in general, the states where the autism rate tends to be highest (according to IDEA) are states that are north of The Mason Dixon Line. There are several possible reasons for this… northern states get less sunlight proportionately, so people who live in the north get less vitamin D. Northern states also have much higher concentrations of heavy metals in the environment from coal mining and coal burning power plants. This is important because it’s not just the mercury and aluminum in the vaccines that causes autism.
Vaccines contain free glutamic acid, which destroys glutathione. Couple that with pediatrician’s advice to “take Tylenol” (which also destroys glutathione) and you have a child whose system is not able to detoxify. When a child is not able to detoxify and he or she lives in parts of the country where there are high levels of heavy metals (and other types of pollution), you get higher rates of autism. The metals and other toxins in vaccines are doing a lot of damage… but even without the metals in the vaccines, the fact that glutathione is depleted by the free glutamic acid in them means that even if you got rid of all of the mercury and aluminum, vaccines would still cause the neuro-immune-gastrointestinal problems known as “autism.”
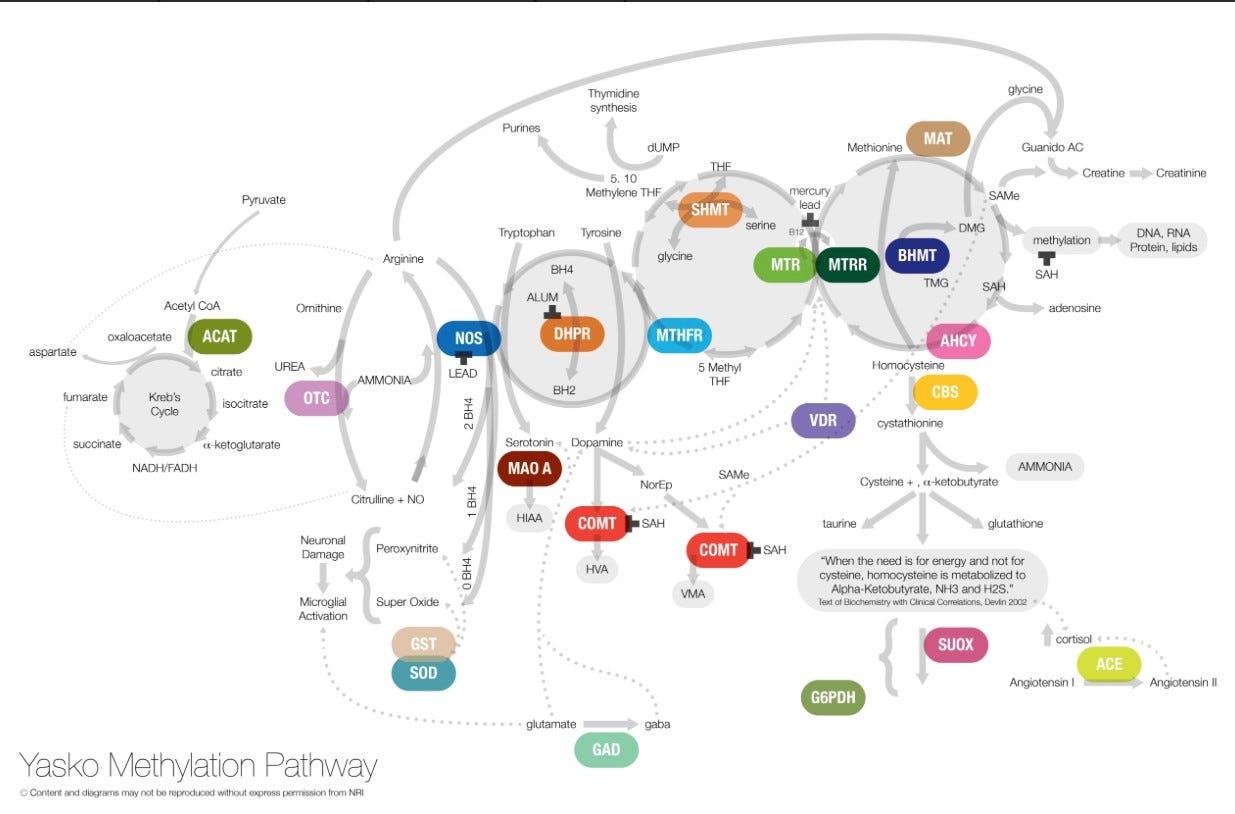
Update (2024): Since I wrote the 2012 article, I have continued to learn about the methylation pathway and the cytochrome P450 pathway and how genetic SNPs (single nucleotide polymorphisms) in those pathways negatively affect an individual’s ability to detoxify from environmental exposures. The methylation pathway is extremely important in detoxifying from exposure to heavy metals (and light metals, including aluminum). The end product of a correctly working methylation pathway is glutathione. When the pathway does not work correctly, toxins build up in the body at a rate that is much higher than they do in someone who does not have those genetic differences. One example of this effect can be seen in this 2004 study looking at the incidence of MTHFR genetic SNPs in children who developed regressive autism after vaccination. The study found that 98% of the children diagnosed with regressive autism had genetic SNPs (mutations) in MTHFR. The rate of MTHFR genetic SNPs in children with regressive autism was far higher than among children without autism or other neuro-developmental diagnoses, and the difference was highly statistically significant. For those who are not familiar, MTHFR is one of many places along the methylation pathway. It’s the one most people have heard about and the one most studied. It is far from the only place where things can (and do) go awry. The following diagram from Dr. Amy Yasko (methylation pathway guru) illustrates the complexity of the methylation pathway.
As noted above, people who have problems detoxifying and who live in areas with higher levels of environmental toxins will understandably experience higher rates of chronic illness, including what we call “autism.” Coal burning power plants are one very significant source of environmental toxicity. I should clarify that the northern states are certainly not the only places where there are high levels of pollution – and there are plenty of heavy metals in many of the southern states as well. Texas, for example, has an abundance of pollution, including that which comes from coal and oil. To see how environmental pollution correlates with the autism rate, please look at the next graph:

Comparison of Autism Rates in Texas Schools with Pollution in Texas Counties.
Okay, so I guess my question is… Why is The CDC not looking at this?
Why do they continue to act like they have no idea what is causing the autism epidemic?
Here’s a clue…
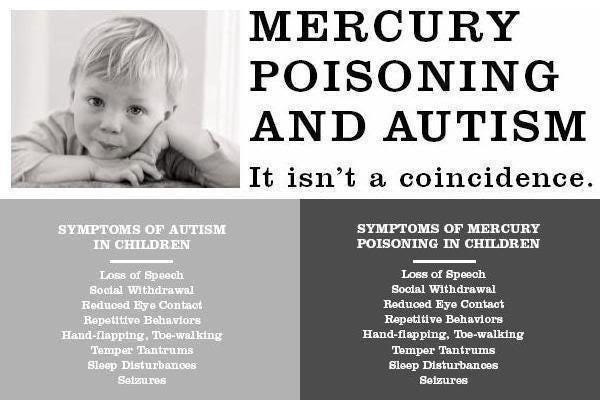
To read more about mercury poisoning and autism, please visit Safeminds (after you finish here, of course).
If the CDC actually started gathering data for their autism prevalence reports from places where vast numbers of children are being poisoned by environmental mercury because they cannot detoxify and are continually exposed to it, more and more people would become aware that for many people who carry the diagnosis, what we call “autism” IS mercury poisoning. This is especially true for those who were born prior to the year 2000, and who were vaccinated according to the CDC Childhood Schedule, with vaccines that contained high levels of Thimerosal, which is 49.6% mercury. While much of the mercury in vaccines has been removed since 2000, children are still being exposed in utero when their mothers receive a flu shot from multi-dose vials. And when even the smallest amounts (“trace amounts”) of mercury are combined with the high levels of aluminum in vaccines given in utero, infancy, and early childhood, the damaging effects are synergistic. The CDC cannot allow that to be known, so once again, true to form, they refuse to study the children who got sick and they refuse to study the connection between vaccines, environmental toxins, and “autism.”
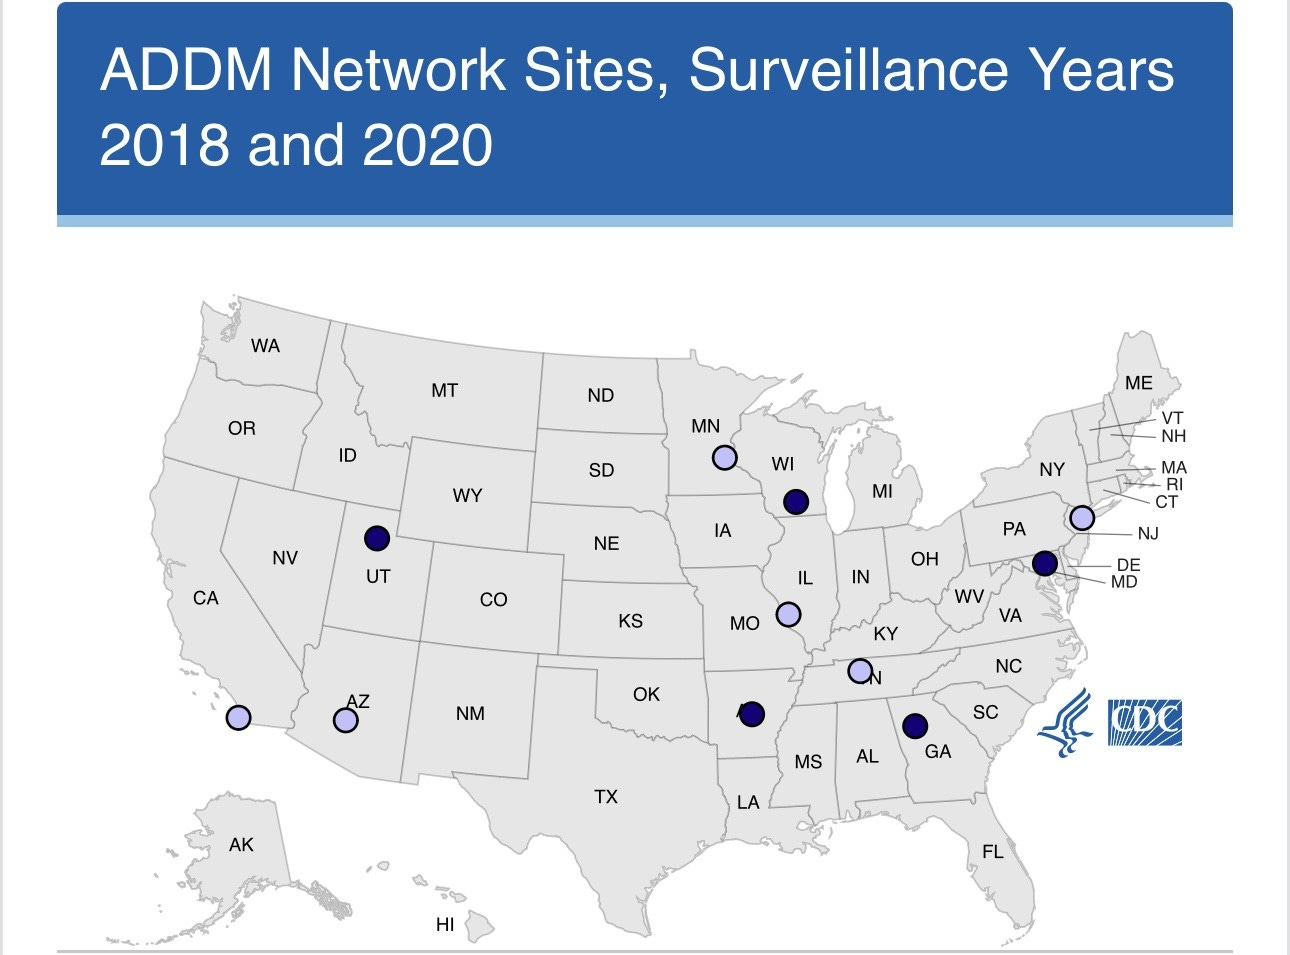
At this point, we have been talking about how the CDC gathered data for the 1 in 88 number released in 2012. You may be wondering if the CDC has changed the way it collects the data on autism prevalence since 2012. Maybe they have started actually gathering data from places where the rates are higher? The following map shows the sites from which the data was gathered in 2020, which led to the 1 in 36 number reported in 2023.
(Source)
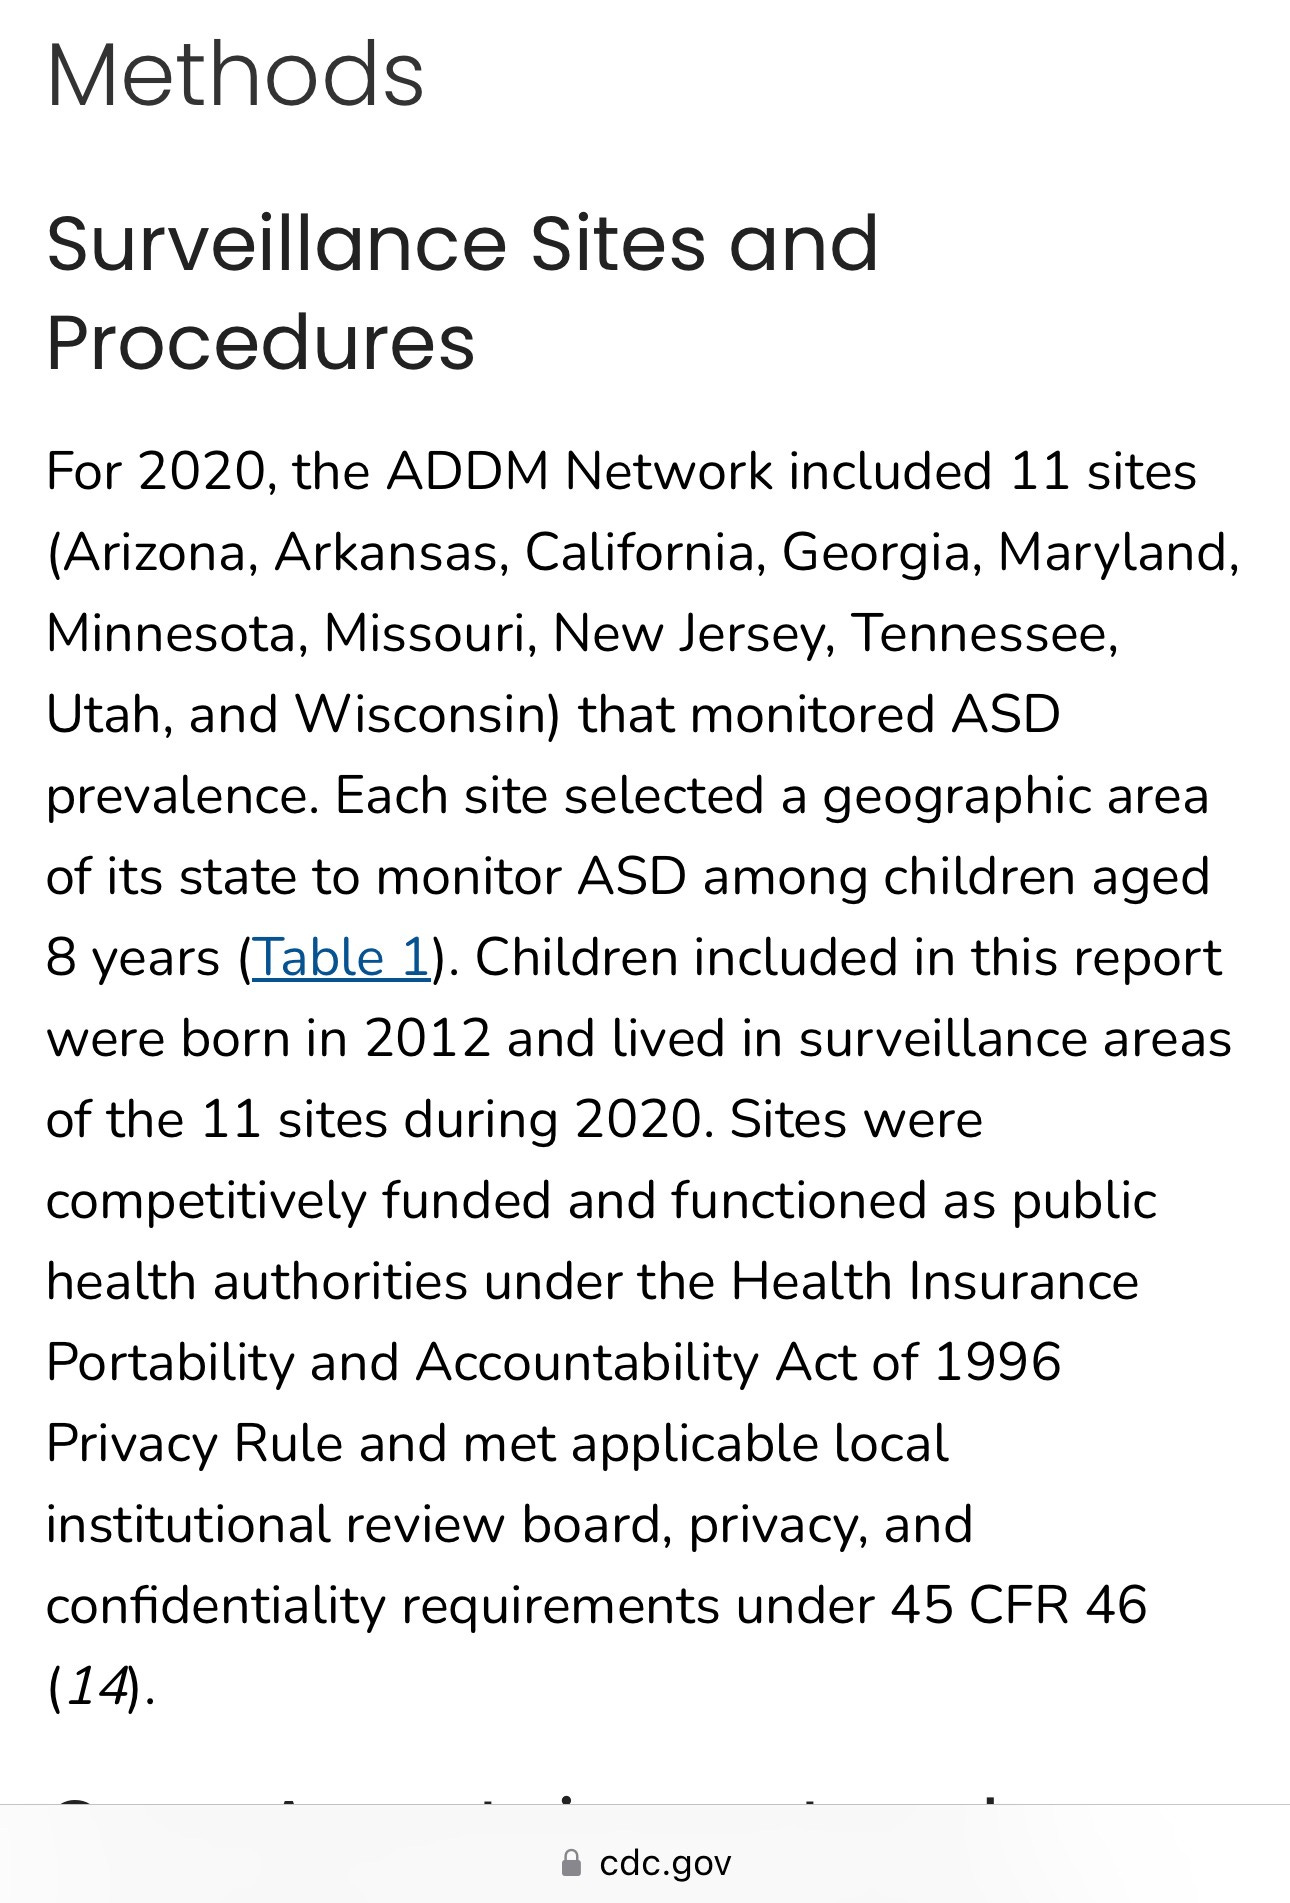
In 2020, the CDC gathered their autism data from sites in the following eleven states: Arizona, Arkansas, California, Georgia, Maryland, Minnesota, Missouri, New Jersey, Tennessee, Utah, and Wisconsin. As noted above, of the states from which the 2008 data was collected (reported in 2012), only one of the top ten states with the highest rates of autism (per IDEA data) was included in that collection.
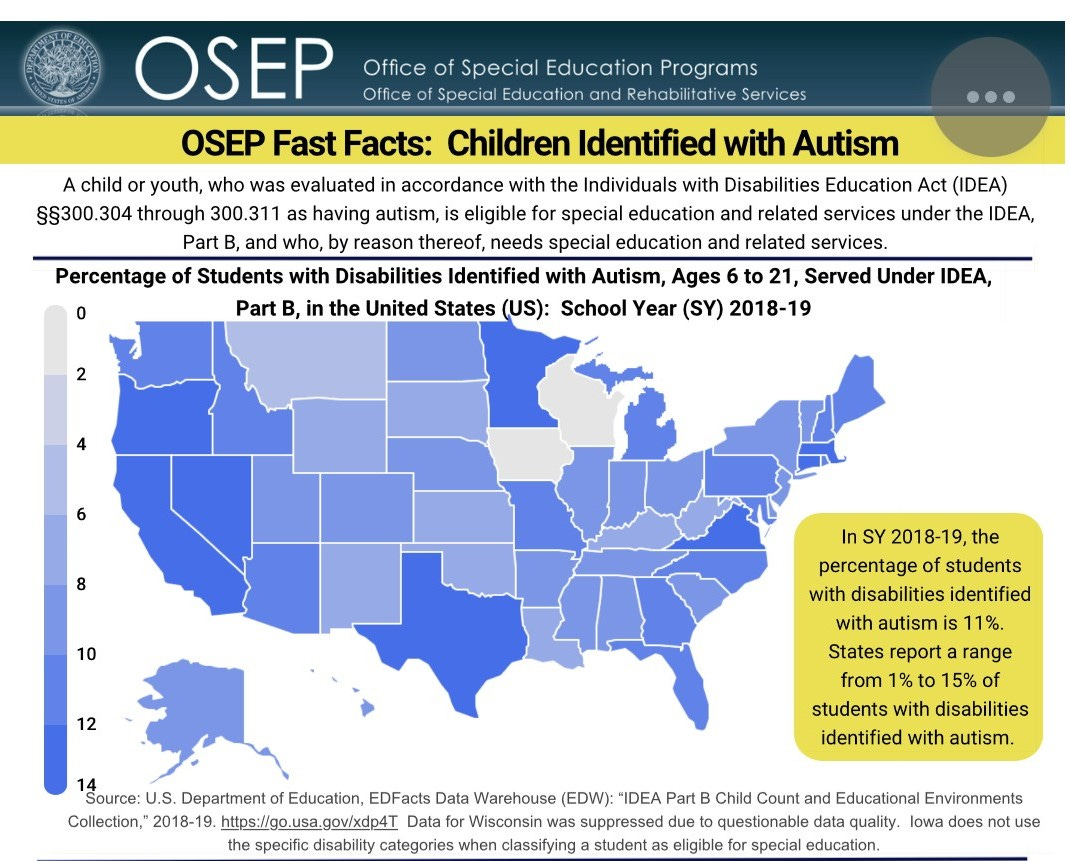
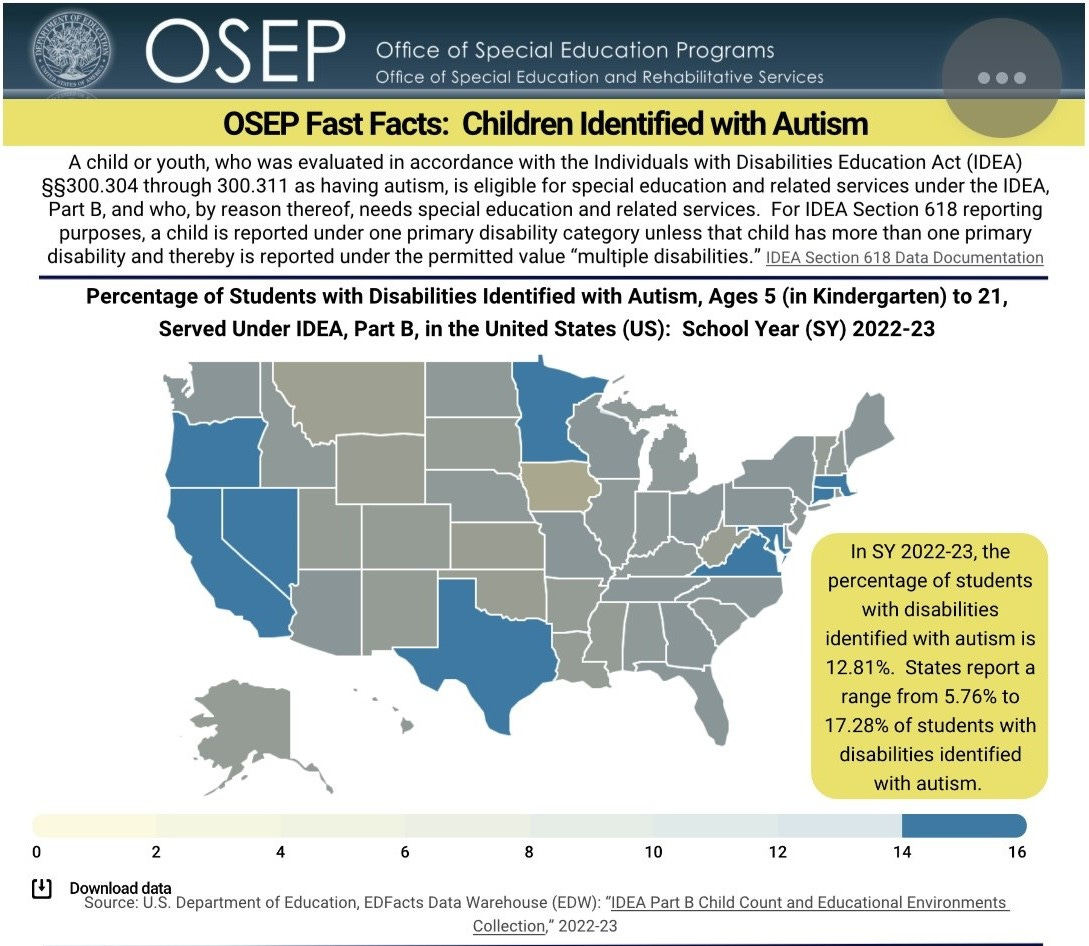
What does the data show, regarding the states with the highest rates of autism among students currently enrolled in the public education system in the United States? The two maps below show the IDEA data for autism for school years 2018-19 and 2022-23.
(source)
(source)
According to the United States Office of Special Education Programs, the states with the highest rates of students being served because they have an autism diagnosis (as of 2022-23 school year) are: California (17.28% of students enrolled in special education services), Nevada (16.37%), Minnesota (16.26%), Virginia (15.64%), Texas (15.12%), Massachusetts (15.03%), Oregon (14.57%), Connecticut (14.34%), and Maryland (14.28%). If you compare the maps from 2018-19 school year with the map for 2022-23 school year, the same nine states are the highest. Maryland is not among the highest states in the 2018-19 school year because the rate was 11.97%, missing the 12-14% cutoff by 0.03% that year. California and Maryland were the only two states from which the CDC gathered data for their official ADDM report.
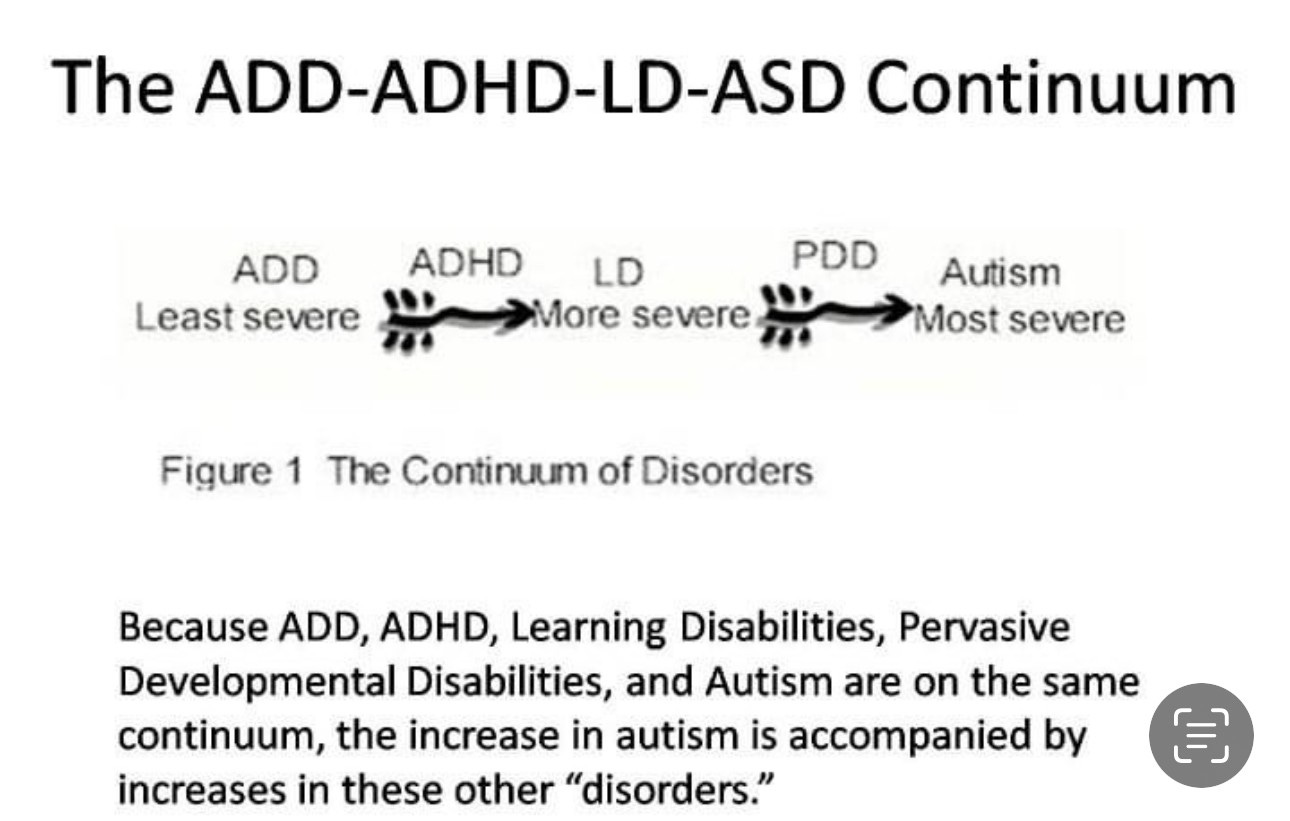
After I published the 2012 article on VaxTruth, some people commented that one reason for the difference in autism rates is because the rates of diagnosis are different from one state to another due to difficulties in obtaining an autism diagnosis. These difficulties include shortages of psychologists to perform the necessary evaluations in some areas. This is a valid point. Having worked in multiple states and in different capacities as a psychometrist in a community mental health center (Mississippi and Alabama), neuropsychological evaluator in private practice (Maryland/D.C. area), and school psychologist in the public school system (Indiana), I can attest to the fact that there is great variability in how children are assessed and diagnosed, depending on where one lives and what financial resources one has available. Some children are diagnosed with ADD/ADHD and Learning Disabilities (including Communication Disorders), when they might be diagnosed with PDD (which falls under the autism umbrella) or Autism in other settings.
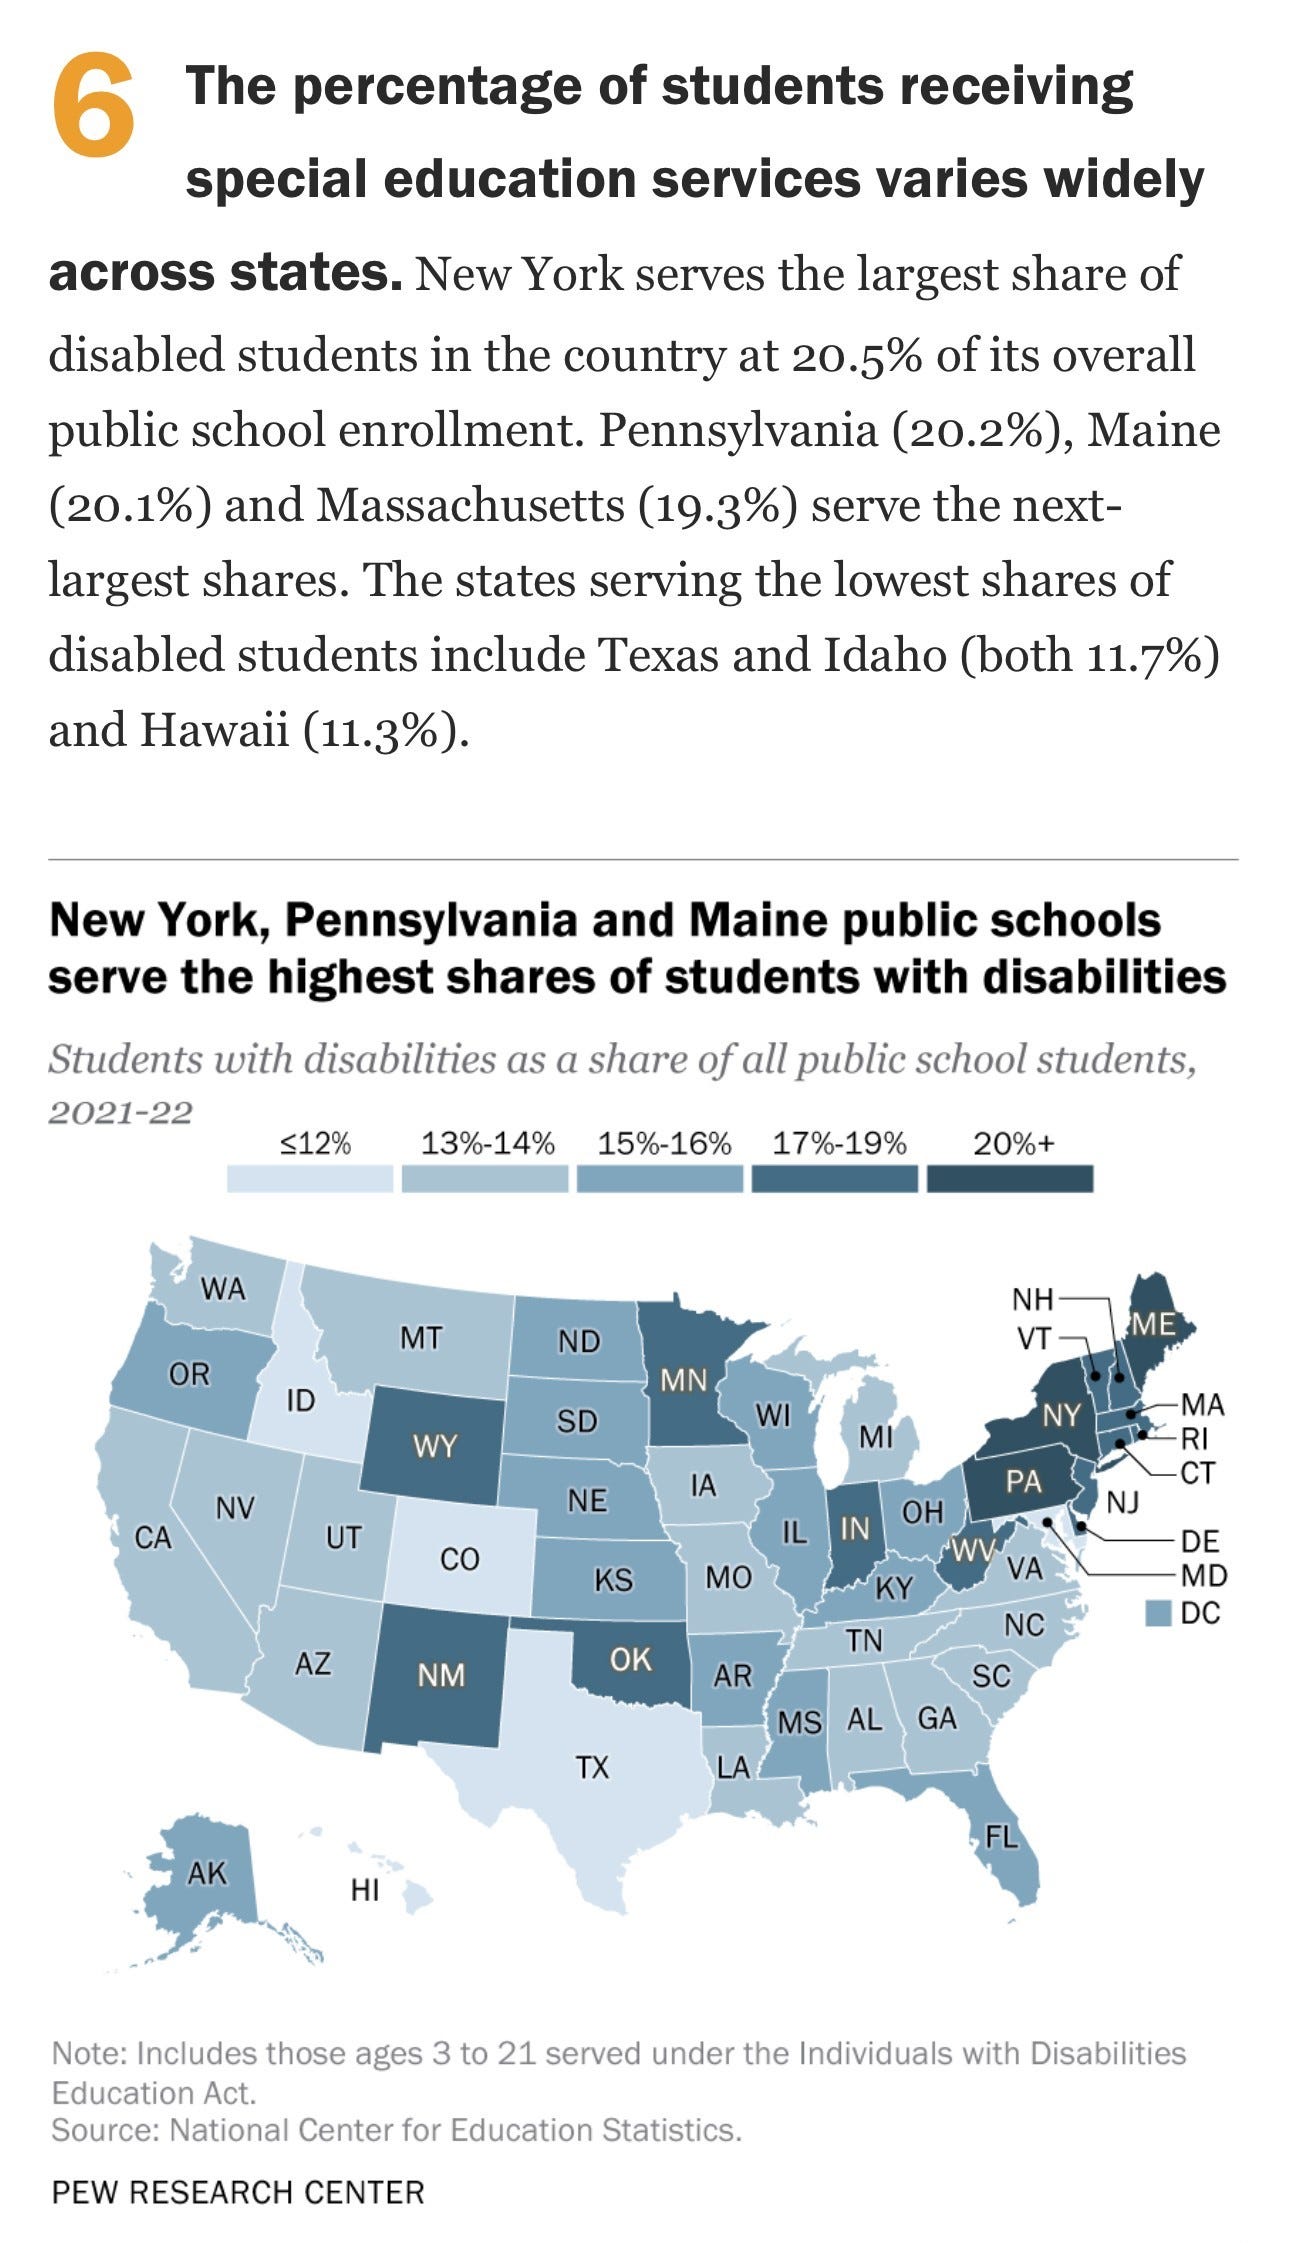
All of these neurodevelopmental disorders fall under the Special Education umbrella, so one way of looking further as we attempt to ferret out the truth about the CDC’s numbers is to look at the overall rates of special education services in the United States.
(source)
New York, Pennsylvania, Maine, and Massachusetts top the list when it comes to having the most students being served under the overall special education umbrella. None of these states was included in the CDC’s data gathering. It’s almost like they really do not want to include those states because the true numbers would be so much higher than what they feel the public will accept without storming the doors of the place demanding answers.
Back to the numbers…
After the 1 in 88 number was announced, I did a little bit of chicken scratch in an effort to determine what might be a closer estimate of the rate of autism. Here is what I came up with:

I told you it was chicken scratch...
I’ll break it down…
In 2012, the CDC reported that their “new” numbers represent a 78% increase over the previous number of 1 in 150. Remember, 1 in 150 comes from data regarding children who were 8 years old in 2002. The 1 in 88 number is regarding 8-year-olds and the data was gathered in 2008. The children were born in 1994 and 2000, respectively. To calculate the yearly rate of increase, I divided 78% by six, for an estimated annual increase of 13%.
According to the CDC, the rate among 8-year-olds in 2008 was 1 in 88. Calculating the yearly increase (13%) yields the following estimates of the autism rate for 8-year-olds:
1 in 78 (2009)
1 in 69 (2010)
1 in 61 (2011)

The number for children who were 8 years-old in 2012, who were diagnosed with autism is estimated to be 1 in 54.
To get an idea of the true incidence, including those younger children with autism who were not counted by the CDC because they were not yet 8 years old, I extrapolated out five years at the same 13% rate of increase.

Estimated rates of autism among U.S. children in 2012:
7-year-olds – 1 in 48
6-year-olds – 1 in 42
5-year-olds – 1 in 37
4-year-olds – 1 in 33
3-year-olds – 1 in 29

Extrapolating out for the next ten years at the same 13% yearly increase, the predicted rate of autism among 3-year-olds…
2013 = 1 in 26
2014 = 1 in 23
2015 = 1 in 20
2016 = 1 in 18
2017 = 1 in 16
2018 = 1 in 14
2019 = 1 in 12
2020 = 1 in 11
2021 = 1 in 10
2022 = 1 in 9
Sobering. Isn’t it?
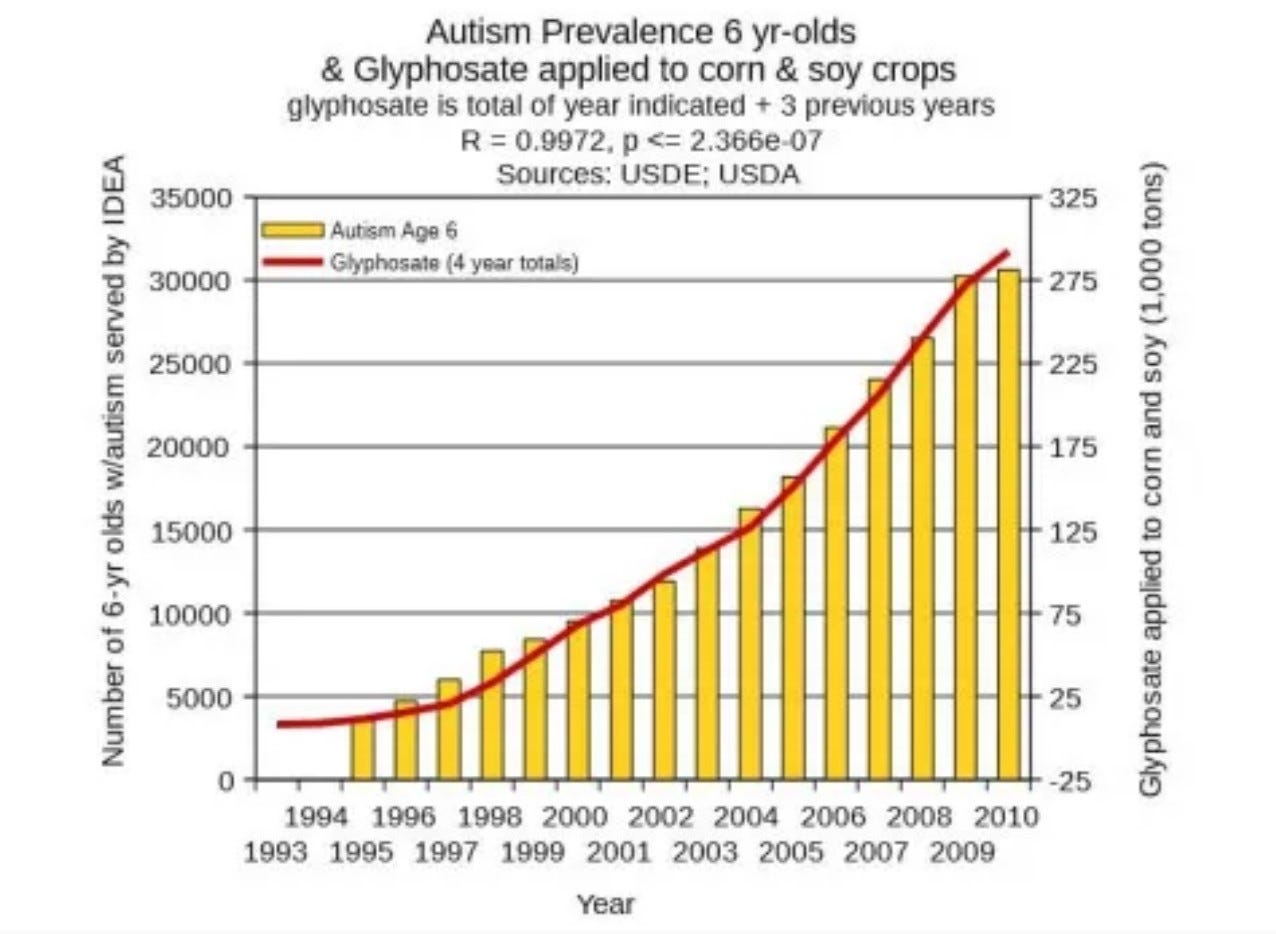
As I noted in my Facebook post (screen shot at the beginning of this article), Dr. Stephanie Seneff performed a similar analysis of the data in 2012. Dr. Seneff and I had not met at that time, and neither of us communicated with the other in any way. Our analyses were completely independent of each other. In Dr. Seneff’s analysis, she predicted that by 2025, one in two children in America will be on the autism spectrum. Dr. Seneff has put together an incredible body of research on glyphosate and the effects of the pesticide on children diagnosed with autism. You can find her work here. The following graph from Dr. Nancy Swanson provides a visual of the exponential growth curve showing the association between autism diagnosis and glyphosate usage in the United States. It’s pretty convincing.
Have you heard about the most recent “discovery” that children on the autism spectrum have gut microbiomes that differ significantly from children without an autism diagnosis? I wrote about that a few weeks ago. One of the things that contributes to the damage in the gut microbiome (in addition to vaccines) is glyphosate. Here are a couple of articles from the peer-reviewed medical literature where you can read more about that:
Of course, as is always the case when Big Business (Big Ag, Big Pharma) stands to lose Big Money when the harms of their products are brought to light, industry-paid “scientists” set to work quickly to attempt to discredit Dr. Seneff and her findings, arguing that glyphosate is “safe.”
The argument that glyphosate cannot be responsible for the increase in autism is based on the scientific literature that says the amount of glyphosate encountered through dietary and environmental exposure is effectively excreted through the cytochrome P450 pathway. That argument sounds very much like the argument that vaccines and their neuro-immune toxic ingredients cannot cause autism because the amounts of aluminum, mercury, formaldehyde, Triton-X 100, polysorbate 80, etc… are “so small that they are excreted effectively within a few days.” Both of these assumptions balance heavily on the premise that the pathways responsible for excretion are working optimally. But what happens to infants and children who cannot excrete these substances because they have genetic differences (single nucleotide polymorphisms/SNPs) that result in the pathways not working the way they should? Just because someone with optimal methylation and CYP450 pathways can excrete these toxins effectively – or at least with enough efficacy to prevent toxic buildup at the level that results in clinically significant symptoms – that absolutely does not mean that those with genetic SNPs impairing their ability to detoxify do not experience significant buildup of toxins, resulting in significant clinical symptoms, including those symptoms associated with autism. Or other neuro-immune related developmental disorders (ADD, ADHD, Learning Disabilities…).
In this article I have already discussed the methylation pathway and its importance in the detoxification of metals, including aluminum and mercury, and how genetic SNPs in the methylation pathway impair a child’s ability to excrete the toxins in vaccines. Research conducted in an attempt to understand the etiology of autism indicates the same is true for the CYP450 pathway. People with autism have been found to have genetic SNPs in that pathway, too. This negatively affects their ability to excrete toxins that are processed through the CYP450 pathway, including glyphosate. This is a good place to start if you are just beginning your research on the CYP450 pathway and its role in detoxification.
So, what we have is an explosion of sick children who are being exposed through air, water, contaminated foods, and vaccines to environmental toxins that they are unable to effectively eliminate from their bodies. It’s synergistic toxicity.
Synergistic toxicity is what happens when you have multiple toxic exposures, and the combined effect of those exposures is greater than the effect of either exposure alone. The classic example of the harmful effects of synergism is mixing alcohol with drugs. If you drink a sixpack of beer or four shots of Tequila, you will experience the effects of alcohol on your body and brain. If you use opiate pain medication or anti-anxiety drugs like Xanax or Ativan, you will experience the effects of those drugs on your body and brain. If you mix alcohol and drugs at the same time, the effects will be greatly magnified and will occur at lower doses, due to the effects of synergism.
Synergistic toxicity occurs because of the effects of vaccines and other pharmaceutical products, heavy metals, pesticides (including glyphosate), and other environmental exposures. It happens to all of us in varying degrees. The effects are mediated by where we live, what we are exposed to, and how efficiently we clear those toxic exposures from the body. For those of us who have genetic SNPs in the methylation and cytochrome P450 pathways, the effects of synergistic toxicity will be greatly magnified over the effects in someone who does not have those same genetic differences. This is why the statement, “If vaccines caused autism, all vaccinated children would be autistic” is invalid. It does not consider the effects of individual differences or genetic susceptibility. When it comes to individuals with autism, we are quite literally talking about the canaries in the coal mine. What is happening to these children is happening to all of us. It just shows up in them at an earlier age and with more devastating results.
Note: Because many of the toxins we are being exposed to are mutagenic, they alter DNA. The mutations in DNA are passed to subsequent generations, making those children more vulnerable to toxic exposures at lower doses. This is the study of epigenetics - the interaction of genes and the environment, and it explains why there are some children diagnosed with autism who have never had a vaccine. I have personally seen some of these children and have investigated several of these cases. In every case, there was a family history of very significant exposure to heavy metals (including mercury and lead) and pesticides. Vaccine-free children who have been diagnosed with autism are very often the children and grandchildren of farmers and coalminers.
Summarizing where we are at this point in this discussion…
We have looked at the CDC’s deceptive practices in how they gather the data for their “official” rate of autism.
We have looked at the more realistic numbers from 2012, using a cumulative frequency analysis and extrapolating the data, using the CDC’s numbers and their rate of yearly increase, which tells us that the true rate of autism among 8-year-olds in 2012 was 1 in 54, not 1 in 88, as the CDC reported.
We have seen that, using the CDC’s own numbers and rate of yearly increase, a realistic number for the rate of autism in three-year-olds in 2012 was 1 in 29.
We have seen that the CDC has not changed its practice of cherry-picking data for their analysis.
We have discussed genetic vulnerability to toxic exposures.
We have discussed some of the major contributing factors that are fueling the exponential growth of autism (as well as other neurodevelopmental disorders and other forms of chronic illness) and which are combining to create synergistic toxicity.
What does the data tell us about the realistic rate of Autism in the United States as of 2024?
The following table from the CDC’s ADDM webpage shows the “official” data on autism prevalence, according to the CDC:
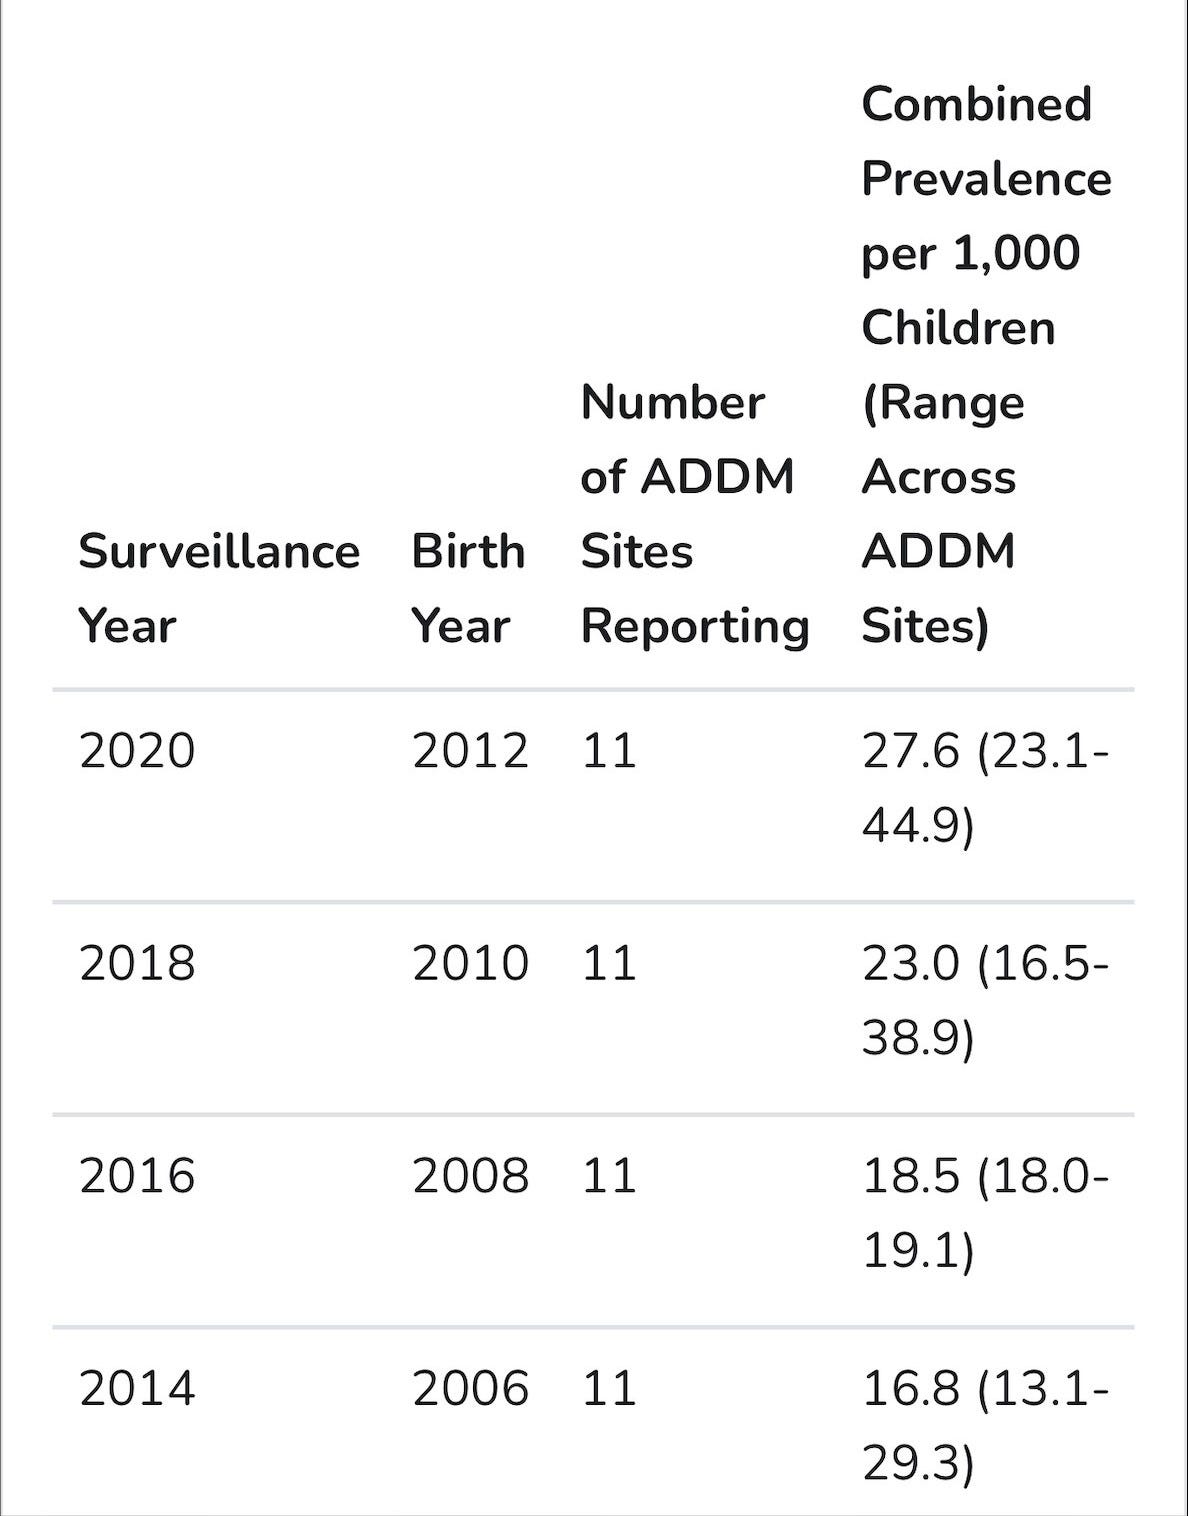
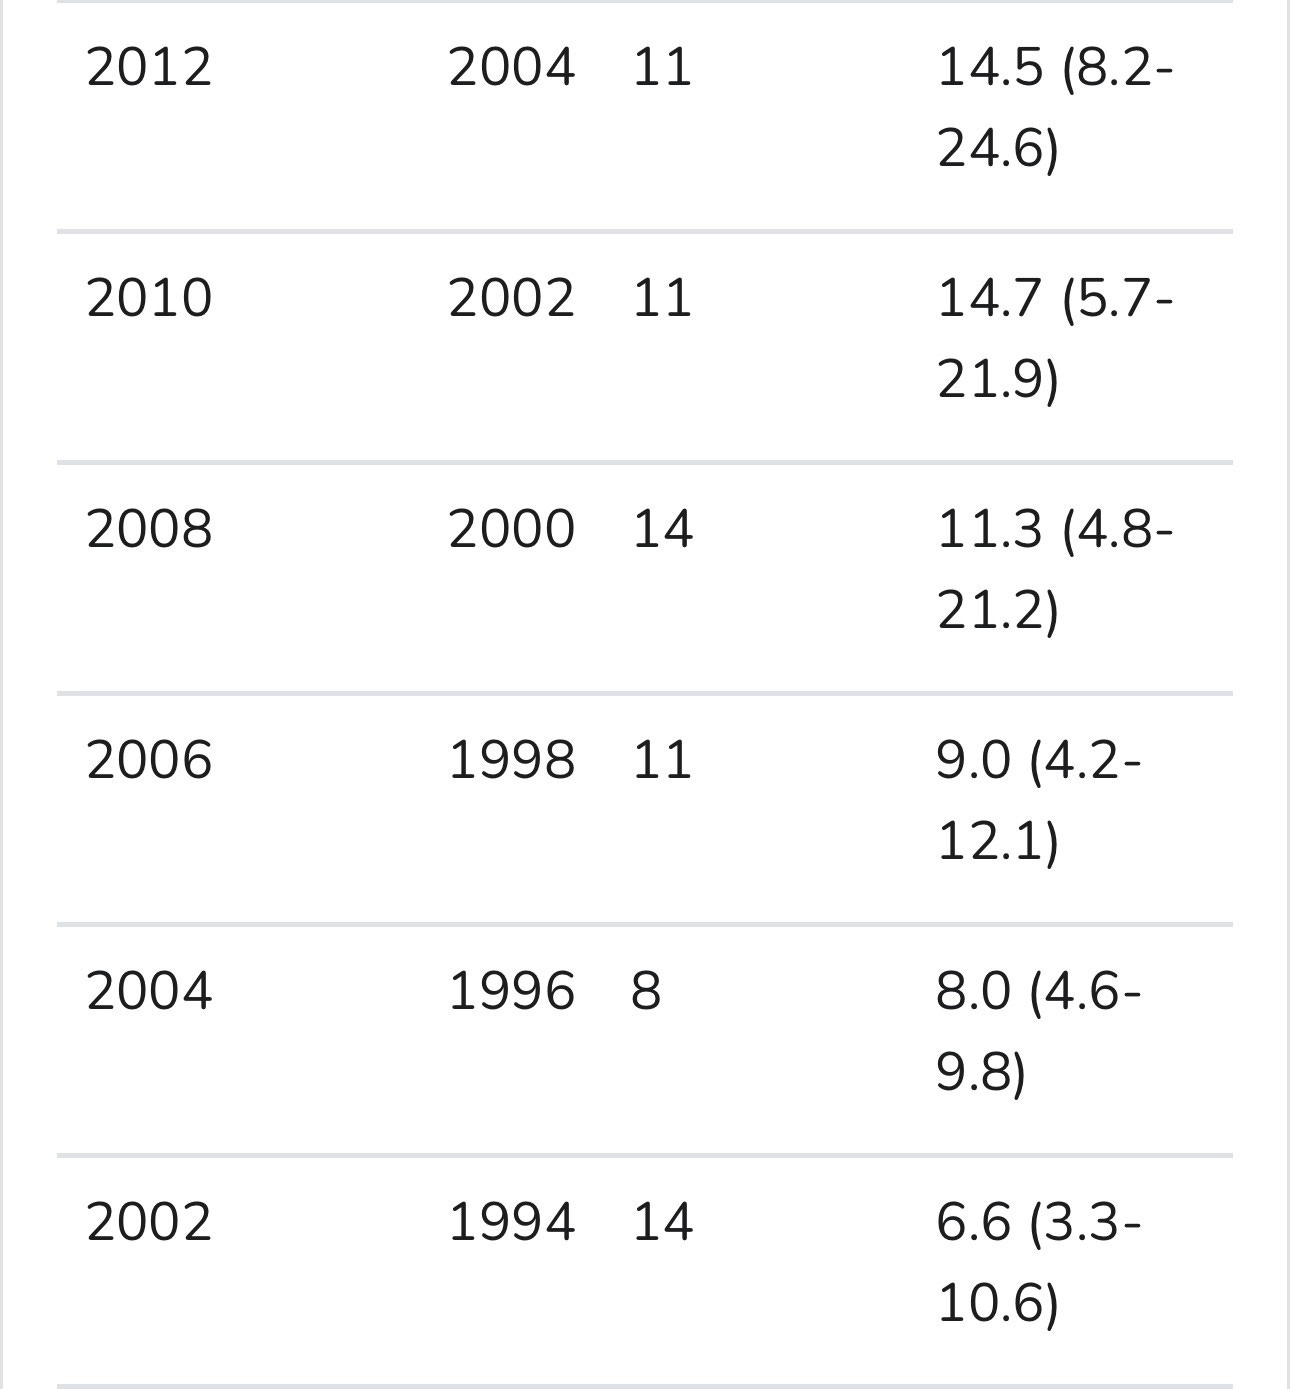
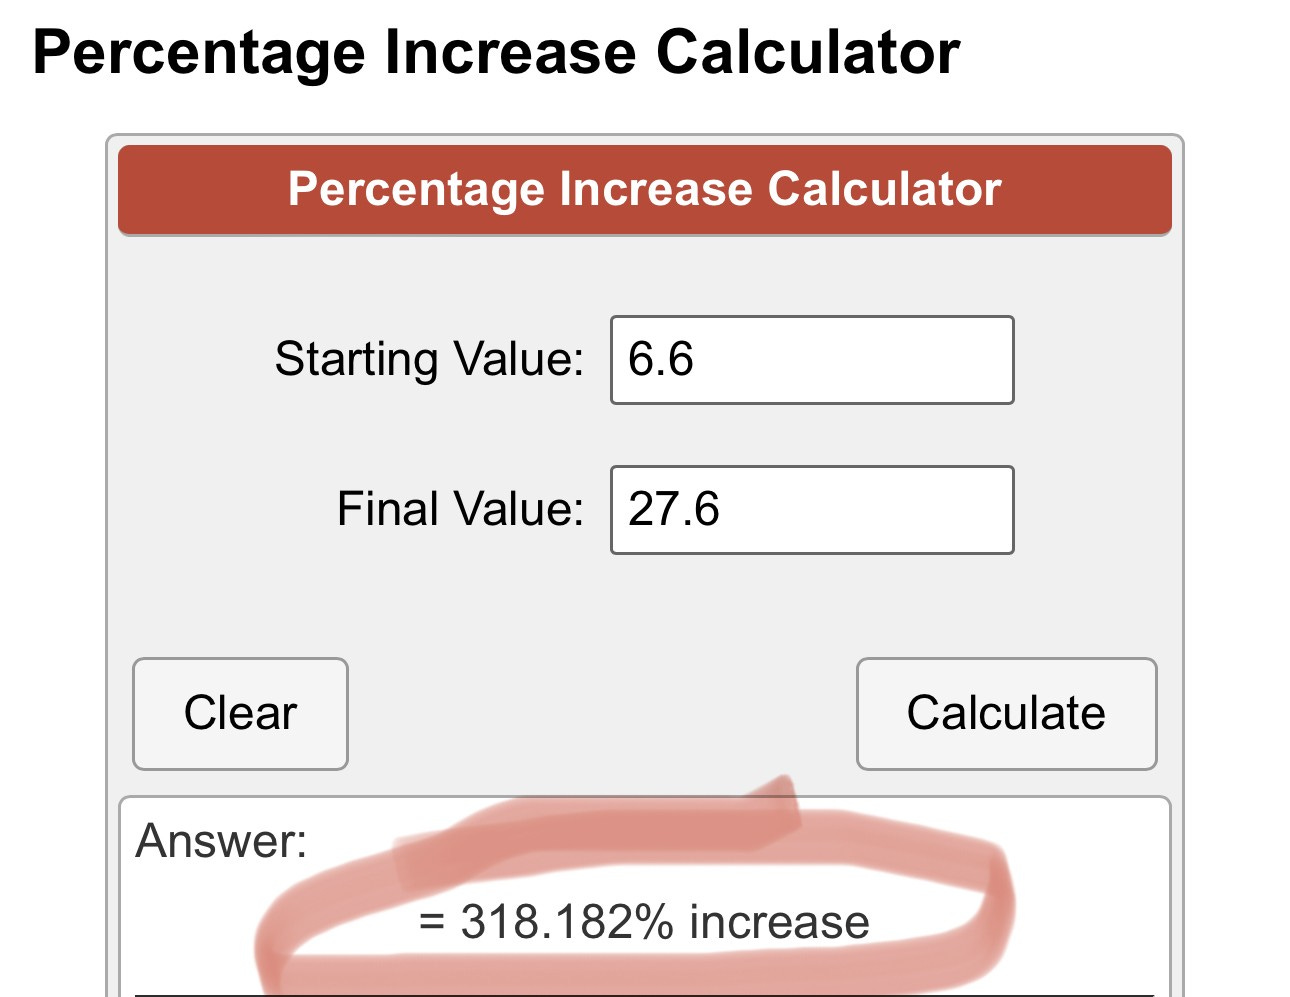
According to the CDC’s ADDM data, the estimated rate of autism spectrum disorders in the United States was 1 in 150 (6.6 per 1,000 children) in 2002, for children born in 1994. According to ADDM data collected in 2020 on children born in 2012, the estimated ASD prevalence for American children was 1 in 36 (27.6 per 1,000 children). According to the ADDM data, over an 18-year period, the ASD incidence has increased by 318%, which breaks down to an average yearly increase of 17.67 percent. (318/18 = 17.67)
Calculating the estimated rate of ASD for American children, as of 2024:
These are the steps for a cumulative frequency analysis:
Taking the most recent data (27.6/1,000) we need to know how much is 17.67% of 27.6. That number is 4.86. We add 4.86 to 27.6. (27.6+4.86=32.46). 32.46 is the number of children with ASD per 1,000 eleven-year-olds. Next, we divide 1,000 by 32.46 to get the rate. 1000/32.46 is 30.8. The rate for 11-year-old children in 2024 is 1 in 31.
Just as I did in 2012, I calculated the rate using the CDC’s numbers and their rate of yearly increase in my cumulative frequency analysis. Just like I did in 2012, I extrapolated the data out in a predictive analysis of what is to come. (This time I won’t subject you to chicken scratch.)

As you can see from the table above, using the CDC’s own numbers, the current rate of autism among three-year-old children in the United States is 1 in 8. (Note: The reason I titled this article “When 1 in 36 is Really 1 in 8” is because when I wrote the 2012 article, “When 1 in 88 is really 1 in 29,” the 1 in 29 number was for three-year-olds. Trying to be consistent in my reporting…) The number for children born in 2024 is 1 in 5. The expected number for children born in the United States is 1 in 2 by 2030. Not at all far off from what Dr. Stephanie Seneff’s analysis showed back in 2012. Not at all far off from the 1 in 9 by 2022 number (for 3-year-olds) I came up with when I ran the numbers in 2012.
As sobering as these numbers are, please remember that this analysis is based on the CDC’s numbers, and please remember that in gathering those numbers, the CDC did not use data from the states with the highest rates of autism, according to IDEA data. That means the true estimates are likely to be even more concerning, and even closer to Dr. Seneff’s predicted rate of 1 in 2 for children born in 2025.
Think about this when The CDC tells you there’s no need to panic….
Think about it every time you get asked to donate to Autism Speaks, the mega-organization with the Park Avenue office space, executives with six-figure salaries…
The Cost of Autism:
In 2006, the cost of caring for a person with autism over the lifespan was estimated to be about $3.2 Million. And the costs of caring for all persons with autism in the United States was estimated at $35 Billion per year.
In 2012, Autism Speaks released the results of research funded by that organization, indicating that the yearly cost of caring for Americans with autism had tripled since 2006, with an annual cost of $126 Billion. Interestingly, the 2012 report from Autism Speaks put the cost spent per person at $2.3 Million over the lifespan, reflecting a decrease of nearly a million dollars per person when compared with results from 2006. It is not clear why the cost per person has come down… From what I have been hearing from many of my friends who are parents of children who carry an autism diagnosis, I believe the lower estimates of the cost of lifetime care may be related to the fact that more and more children are being denied the early intervention services they so desperately need. As funding for programs is cut, so are the services for children (and adults) with autism. If you don’t provide funding for services, the overall cost per person comes down. The fact that the annual rate spent providing for all persons with autism tripled in six years’ time is an indication that we do indeed have an epidemic on our hands.
We were spending $900,000 less per person, but the bottom line tripled.
By 2013, the annual cost of caring for children and adults on the autism spectrum (United States) was between $236 Billion and $262 Billion.
A study published in 2020 estimated the lifetime cost for care of a single person with autism at $3.6 Million. The study, entitled “The lifetime social costs of autism: 1990-2029,” reported that the overall cost of caring for persons with autism born between 1990 and 2029 will be $15 TRILLION.
Tell me how that makes sense if it’s not time to panic?
One Last Thought…
As you ponder the thought of 1 in 2 children with autism by the year 2030, consider this: As high as the autism rate is among the general population, it is even higher among children of military personnel. And, if you are a child with autism and your parents happen to be in the military, you are even less likely than your non-military peers to receive early intervention services, which means you are more likely to have a poorer outcome over the long run.
Now think about this… Historically, children of military personnel are six times more likely to enlist or be commissioned into military service. In my own family, my husband served 24 years. His brother served 22 years. Their father served 20 years. Between the three of them, they served 66 years in the United States’ military. That legacy stops with my children. They are not fit to serve in the military. They can’t pass the physical.
Hmmm…
Vaccine manufacturers are protected from liability, which results in zero motivation for them to make safe or effective products.
The reason vaccine manufacturers continue to be protected from liability is because, in the extremely remote possibility that we may face a biological weapons attack, “we will need their vaccines… it’s a matter of national security.”
Because of their faulty products being forced on our children, and because of synergistic toxicity from the combination of vaccines, glyphosate, heavy metals, and other environmental toxins, within the next 10-15 years, there will be virtually no young people in America who are fit for military service.
If you think the crisis in the health of America’s children is not the most important issue facing this country and our national security, you need to pull your head out of your rectum. There simply is no more pressing issue. The tsunami is not coming. It’s already here.

I just posted a link to this gem in like 10 places on the Colorado Depart of health's X account with #vaccineSideEffects. Spread the word people!
Something I don't see mentioned here is that (at least in some states) school autism and medical autism are different conditions. A medical diagnosis in my state doesn't guarantee special education eligibility and the school repeats their own evaluations to determine eligibility. Particularly in children with an average or above average IQ, the school may say that while they are autistic, there's no educational impact, so they're not eligible for special education. If you are only going by the IDEA eligibilities, you're missing a bunch of autistic kids.